Categories
Science Tropical Weather

2014 Hurricane Season. An El Niño Year?

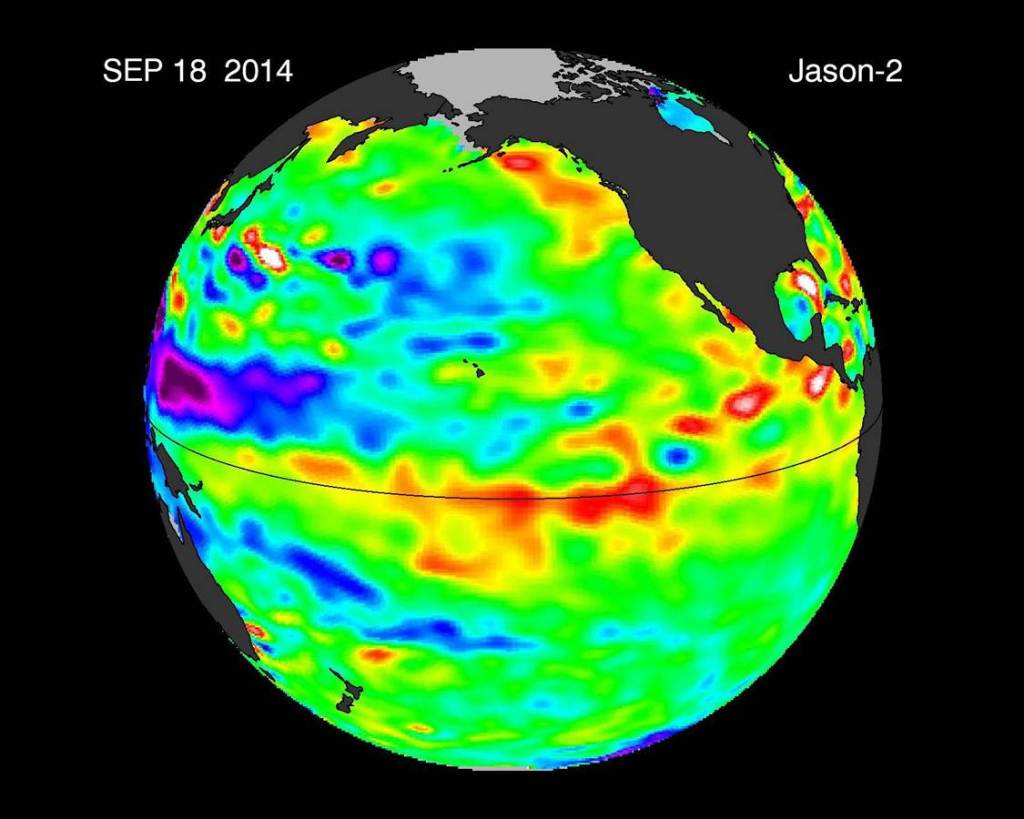
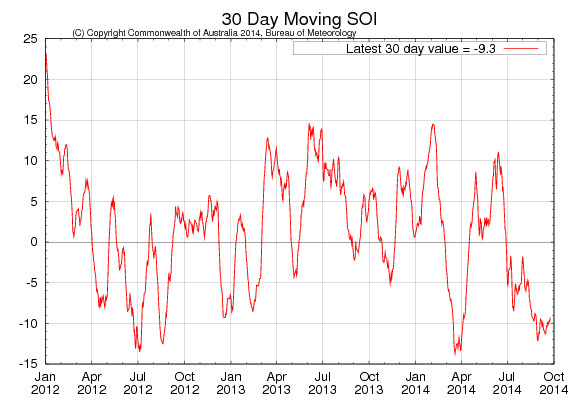
Before the 2014 Atlantic hurricane season began, it was touted by most experts to be an “El Niño” year mostly due to some the early indicators. A few things Meteorologists monitor when it comes to tropical development in general include: Wind Shear strength, Sea Surface Temperatures/Deep Sea Temperatures, measuring of the SOI (Southern Oscillation Index) in the case of an El Niño or La Niña, and the MJO (Madden Julian Oscillation). A simplified description of an El Niño is basically an area in the Pacific Ocean that begins to warm up to more than above average sea surface temperatures. An El Niño can cause strong winds to blow eastward over Mexico and help shear off the cloud tops of thunderstorms. This helps to reduce both the number and the intensity of tropical storms and hurricanes that might be trying develop in the Atlantic. Between February-May, just before the hurricane season would begin, there were a series of Equatorial [tooltip title=”Kelvin waves” content=”Kelvin wave, in oceanography, an extremely long ocean wave that propagates eastward toward the coast of South America, where it causes the upper ocean layer of relatively warm water to thicken and sea level to rise. Kelvin waves occur toward the end of the year preceding an El Niño event when an area of unusually intense tropical storm activity over Indonesia migrates toward the equatorial Pacific west of the International Date Line. This migration brings episodes of eastward wind reversals to that region of the ocean which spawn Kelvin waves. Although such intense tropical storms of the western Pacific are associated with the development of El Niño, they may occur in other years to produce Kelvin waves that also propagate eastward but continue poleward toward Chile and California.” type=”info” ]Kelvin waves[/tooltip] in the Pacific which allowed for the possibility of a moderate to strong El Niño. While the Kelvin waves did transport the higher than normal sea surface heights, the atmosphere did not follow along with the Kelvin waves and the waves eventually faded away. Recently though, two more eastward moving Kelvin waves were seen via the Jason-2 satellite. Will these two Kelvin waves be the precursor for the El Niño? Even if they do, the El Niño would most likely be a weak to moderate one. kelvin-waves_9_18 Courtesy NASA/JPL-Caltech Another possible indicator of an El Niño is that the shift in the SOI has now been in negative territory. Although this is not a true indicator as of yet, the SOI needs to have sustained negative values below −8. Close but no cigar. soi30 Courtesy: Australia Bureau of Meteorology ******* For the math minded ******** There are a few different methods of how to calculate the SOI. The method used by the Australian Bureau of Meteorology is the Troup SOI which is the standardised anomaly of the Mean Sea Level Pressure difference between Tahiti and Darwin. It is calculated as follows:
$latex SOI = 10 \frac{(Pdiff – Pdiffav)}{SD(Pdiff)} \ $

where: Pdiff = (average Tahiti MSLP for the month) – (average Darwin MSLP for the month), Pdiffav = long term average of Pdiff for the month in question, and SD(Pdiff) = long term standard deviation of Pdiff for the month in question. The multiplication by 10 is a convention. Using this convention, the SOI ranges from about “35 to about +35, and the value of the SOI can be quoted as a whole number. The dataset the Bureau uses has 1933 to 1992 as the climatology period. The SOI is usually computed on a monthly basis, with values over longer periods such a year being sometimes used. Daily or weekly values of the SOI do not convey much in the way of useful information about the current state of the climate, and accordingly the Australian Bureau of Meteorology does not issue them. Daily values in particular can fluctuate markedly because of daily weather patterns, and should not be used for climate purposes.

*************************************

So what does this mean for this year’s Atlantic hurricane season? Probably not a whole lot. So far there is no empirical evidence either way to back up any claims of a possible El Niño. What is known is that in the Pacific, trains of Tropical cyclones in the Pacific are still developing where as in the Atlantic basin this has been a very slow hurricane season with one tropical storm and four hurricanes, with Hurricane Edouard being a major hurricane, albeit short lived as a major. As the [tooltip title=”Cape Verde” content=”A Cape Verde-type hurricane is an Atlantic hurricane that develops near the Cape Verde islands, off the west coast of Africa. The disturbances move off the western coast of Africa and may become tropical storms or tropical cyclones within 1,000 kilometres (620 mi) of the Cape Verde Islands, usually between July to September. ” type=”info” ]Cape Verde[/tooltip] season is slowly drawing to an end, the remainder of the tropical cyclone development (if any) will most likely be in the Western Caribbean and the Gulf of Mexico with the possibility of development closer to the U.S. Eastern coast. It would be foolish for me to to postulate whether the rest of the Atlantic hurricane season will continue to be as slow as it has been and whether the forecasted El Niño has been the cause (whether it is classified or not). As a stated in an earlier post:

So, how do we get a better feel of the hurricane season activity for this year? One method called [tooltip title=”ACE” content=”Accumulated Cyclone Energy” type=”info” ]ACE[/tooltip] Index. ACE Index is using a sum of the energy accumulated with all the cyclones (tropical storms, sub-tropical storms and hurricanes) that happened to form within the hurricane season. Calculating ACE is done by using the square of the the wind speed every six hours during the storm’s lifetime. Remember, a tropical depression is below 35 knots and it is not added. Hence, a cyclone that is longer lived will have a higher ACE indices verses a shorter lived cyclone which will have a lower ACE indices.  ACE indices of a single cyclone is windspeed (35 knots or higher) every six hour intervals  (0000, 0600, 1200, 1800 [tooltip title=”UTC” content=”Coordinated Universal Time (UTC) is the primary time standard by which the world regulates clocks and time.” type=”info” ]UTC[/tooltip]) or ACE = 10kn2. Total ACE: $latex \Sigma = \frac{Vmax^2}{10^4} \ &s=2\ $ * Vmax is estimated sustained wind speed in knots. * An average seasonal ACE in the Atlantic is between 105 -115 or mean average of 110. Although technically we are in a Neutral state, this season “almost” seems more like a El Nino year. An El Niño tends to hinder tropical cyclone development in the Atlantic, due to higher amounts shear. But in a true El Niño year, you normally will have a very active season in the East Pacific (EPAC), with a few major hurricanes, and a subdued Atlantic.

In the figure below, as of this time frame, the ACE Index for this year is actually lower than last years (36.1200). That said, there is still October and November for the possibility of Tropical Cyclone development. If any Tropical Cyclones do develop, I will add them into the ACE Index accordingly. Secondly, the ACE Index numbers in the chart are from the Operational Advisories. The numbers may change when the Tropical Cyclone Reports are released. A blue asterisk will be placed next to a Storm name when a TCR has been issued.
Addendum: As of 10/11/14, 0000 UTC advisory with Tropical Storm Fay, the ACE Index has now surpassed last years ACE. In addition, recently developed Hurricane Gonzalo now a category 4 hurricane, the ACE Index will continue to rise significantly. This the first time in the Atlantic basin there has been a category hurricane 4 since Ophelia in 2011.

2014 Atlantic ACE
Tropical Cyclone Name
Max Wind Speed (in Knots)
ACE 104 kn2
Arthur *
85
6.9475
Bertha *
70
5.5175
Cristobal *
75
7.9225
Dolly
45
0.8050
Edouard *
105
15.6325
Fay *
70
3.5600
Gonzalo *
125
25.9725
Hanna *
35
.2450
——–
ACE Total:
66.6025

As always, please be sure to use the official information from the NHC or your local NWS. Although care has been taken in preparing the information supplied through the Weather or Knot blog, Weather or Knot does not and cannot guarantee the accuracy of it. I am not a professional meteorologist and this post is prepared purely for entertainment purposes.
Categories
Science Tropical Weather

Atlantic Hurricane Season 2013. An Active Season??

The 2013 Hurricane season which began June 1st and both the NOAA and ENSO reports are out and the 2013 hurricane season will most likely be a much more active season than the previous years. This hurricane season may be a dangerous one for many in the East Coast of the US, especially the Florida East coast, Florida Keys and the Gulf coast of Florida and possibly even the Caribbean but we will get to that a bit later.

So lets start with the basics of why this season is expected to be different. Beginning with ENSO or El Niño Southern Oscillation. ENSO is a climate pattern in the equatorial Pacific. Many might wonder what does the equatorial Pacific have to do with storms in the Atlantic. Globally, what happens in the Pacific can induce what happens in the Atlantic. Now with ENSO, there are basically three phases. One is a cool stage, another is a warm stage and there is also a neutral stage.

To have a cool stage, abnormal SST’s (Sea Surface Temperature) must have five consecutive overlapping 3-month periods: for example – (June, July, August), (July, August, September), (August, September, October) or more and the abnormal SST’s must be -0.5 degrees Celsius or lower. This also known as an [tooltip title=”La Niña” content=”La Niña is associated with cooler than normal water temperatures in the Equatorial Pacific Ocean” type=”info” ]La Niña[/tooltip]. During an La Nina, abnormal SST’s can allow anticyclones to develop due to convergence (upward motion) which can help induce the possibility of development of a tropical cyclone.

Conversely, a warm stage must have the same five consecutive overlapping 3-month periods: or more and the abnormal SST’s must be at .05 degrees Celsius or higher. This is known as an [tooltip title=”El Niño” content=”El Niño is associated with warmer than normal water temperatures” type=”info” ]El Niño[/tooltip]. During an El Niño, storms in the Pacific will have an impact in the Atlantic. The possibility of tropical cyclones in the Atlantic developing is reduced, usually due to vertical shear. The Neutral stage is stage between the two and normally will only last a short period of time. The Neutral stage basically has no impact on the Global Weather patterns.

Next up, the Atlantic Tripole. When there is an Atlantic Tripole, basically what is happening is that in the tropical area of the Atlantic Ocean you are have warm waters to the south, and then from the tropical area to approximately 40° north latitude you now have a large of much cooler waters. From 40° north latitude northward, there would be an area of warms waters again. Since this is not the normal pattern, sometimes this can have an increase in the amount of convection and lift somewhere between Africa and the Leeward and Windward Islands. This can help the development of any tropical systems.

Hopefully, you are still with me as we talk about the NAO (North Atlantic Oscillation) and the the warm SST’s in the tropical area and the MDR (Main Development Region), MJO (Madden Julian Oscillation), and finally the PDO (Pacific Decadal Oscillation). Please note: I have purposely have left out the [tooltip title=”Indian Ocean Dipole” content=”A coupled ocean and atmosphere phenomenon in the equatorial Indian Ocean that affects the climate.” type=”info” ]IOD[/tooltip] in this discussion. Although it can a contributing factor, I felt we have enough information as is and did not want to add any further possible confusion.

The [tooltip title=”NAO” content=”North Atlantic Oscillation” type=”info” ]NAO[/tooltip] describes the strength of the surface pressure difference that is between the Azores High and the Icelandic Low. The NAO has two phases: a Positive phase and a Negative Phase. With a Positive NAO you have a stronger than average high across the Atlantic, this will increase the trade winds to the south of it. Those trade winds run across the eastern portions of the Atlantic and into the Caribbean. The stronger trade winds allow for increased evaporation cooling which then allows for cooler than average SST’s. Conversely, with a Negative NAO, the Azores High and the Icelandic Low are now weaker than average. So now with a weak high the trade winds will be much calmer allowing the SST’s to increase considerably. The NAO while it is a big player with the SST’s, the NAO also is a player in tropical cyclone development. Consider this, with quicker than average trade winds, any tropical waves will have very rapid movement as they come of the coast of Africa. The tropical waves will find it difficult to consolidate or strengthen if the forward motion is over 20 MPH or more. Not only can the tropical wave find it difficult to strengthen but this can lead to [tooltip title=”Speed Shear” content=”Speed shear is the change in wind speed with height.” type=”info” ] speed shear[/tooltip].

The NAO is also a player in the track of tropical cyclone. Recalling that during a Negative NAO, the Azores high is typically weaker but it is oriented west to east and closer to the US Southeast coastline. During a Negative NAO, any troughs on the East coast will typically be weaker and recurving of a tropical cyclone will be much more difficult to do. A Positive NAO on the other hand will allow recurvature much easier. Please note that the short term timing essentially will govern the track of a tropical cyclone, not the long term mean.

The abnormally above average [tooltip title=”SST’s” content=”Sea Surface Temperature” type=”info” ]SST’s[/tooltip]  is another concern this year especially in the [tooltip title=”MDR” content=”Main Development Region” type=”info” ]MDR[/tooltip]. The MDR is a very large area, extending from the Caribbean Sea to almost the coast of Africa. A warmer than normal MDR will provide the feeding fuel for the beginning of the development but also help nourish tropical cyclones. The minimum water temperature needed for a tropical cyclone to begin development is approximately 26°C or (79° F) and a depth of at least 160 feet but there also other factors needed.

Now let’s get to the [tooltip title=”MJO” content=”Madden Julian Oscillation” type=”info” ]MJO[/tooltip]. What is the MJO?  The MJO is an eastward progression of large regions of both enhanced(positive) and suppressed(negative) tropical rainfall. Simply put, there are two completely different phases with the MJO. One is a negative phase and the other is a positive phase. The MJO is different than ENSO as the MJO moves eastward at between speeds but anywhere from 8- 18 MPH across the different regions in the tropics, crossing the Earth in 30 to 60 days (with an average of 40 days). As it heads eastward and eventually into the East Pacific and then into the Atlantic the two phases are completely opposite of each other. In a Negative phase, lift is subdued and development of a cyclone is harder, but not impossible to have. In a Positive phase, now moisture and lift (upward motion) into the atmosphere allows easier development of a tropical cyclone (increased convection/thunderstorms activity).

Lastly, the [tooltip title=”PDO” content=”Pacific Decadal Oscillation” type=”info” ]PDO[/tooltip]. The PDO is a pattern of change in the Pacific Ocean’s climate. The PDO is easily recognized with cool or warm surface waters in the Pacific Ocean (north of 20° N. latitude). During a Negative or cool phase, the west Pacific  becomes warm and the eastern ocean is cool. Conversely, during a Positive or warm phase, the west Pacific becomes cool and the eastern ocean is now warm. So again you are wondering how does that affect you if you live on the US east coast? During a Negative phase and in the Atlantic basin, the rising of air helps upward lift and possibly allowing more convection which can help promote tropical cyclone development.

So now that you have had a short lesson in Meteorology 101, what does all this mean? In one sense, not a thing, but certain patterns may appear this season and may allow for possible stronger storms and also a much higher chance of landfall somewhere along the US Eastern coast. The past few years, many of the storms were recurved and they went out to sea. [tooltip title=”Trough” content=”An elongated region of relatively low atmospheric pressure, often associated with fronts” type=”info” ]Troughs[/tooltip] would develop, head east and pull the storms up and keep the storms away. This year appears to be different. A more pronounced and elongated Bermuda high will remain allowing any tropical cyclones to be caught under the [tooltip title=”Ridge” content=”A ridge is an elongated region of relatively high atmospheric pressure, the opposite of a trough” type=”info” ]ridge[/tooltip]. If the Bermuda high weakened enough, and a storm was under the ridge of the high and near the southwestern (or the periphery) of the ridge. This may allow the storm may follow around the edge of the high. This may allow a more northwestern track instead of a western track and possibly towards the East Coast of the US. Any storms much further west and if the ridge is still strong would possibly be in the Caribbean and if a system in the Caribbean and if there were a trough over the Plains of the US, this may have a storm heading toward the US Gulf Coast.

Using those different meteorological basics we talked about earlier, lets see why the possible reason why this may be a more active hurricane season.

ENSO

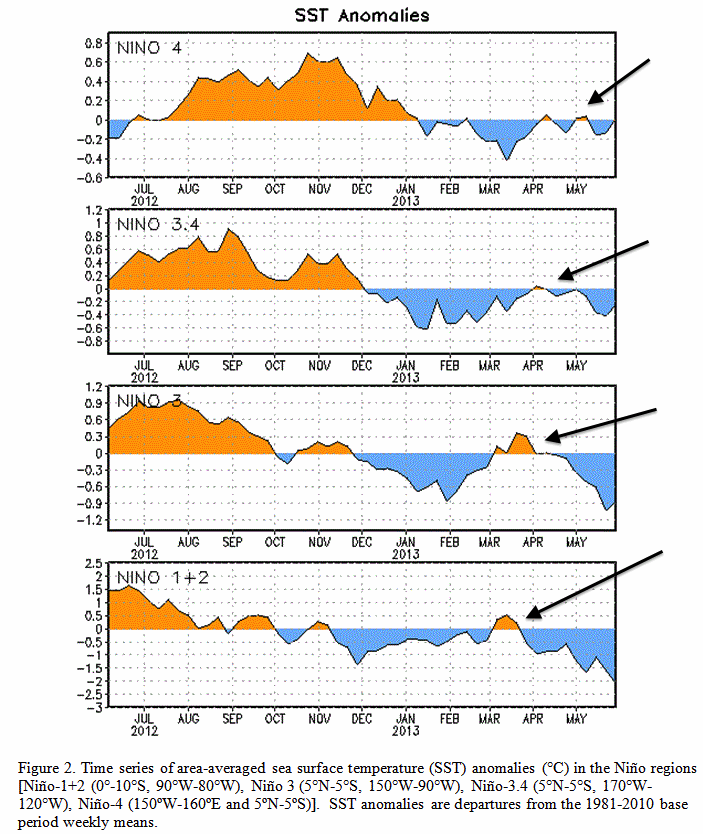
The ENSO is now in a neutral stage. Looking at the SST anomaly chart you must recall that for either an La Niña or El Niño ±o (either -.05° Celsius or .05° Celsius) for the last 3 months or more. Notice that is the chart both NINO 4 and NINO 3.4 have not reached the threshold needed. The short term forecast is that we will be in a neutral stage with a cold bias. Long term forecast is a bit cloudy but it is forecast that later in the season we may have a weak La Niña.

sst anomaly

Atlantic Tripole

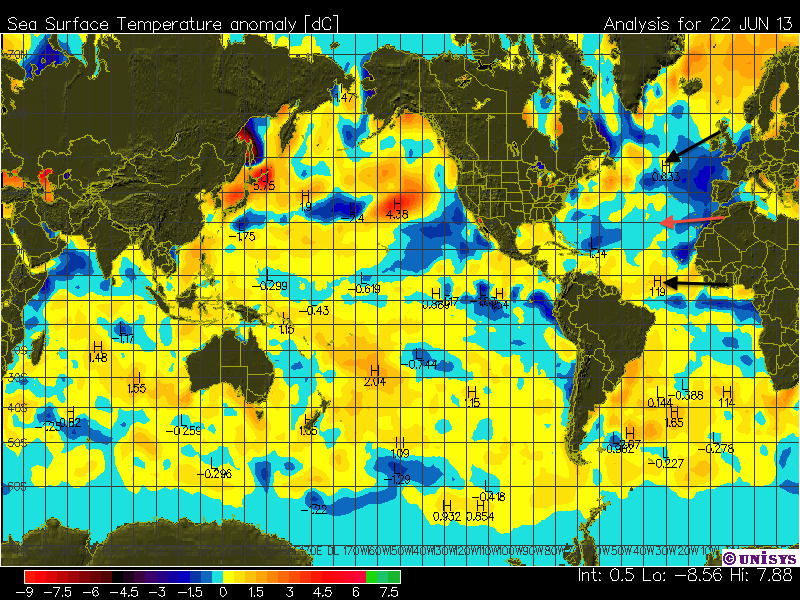
Now it is time again for the Atlantic Tripole. Although the chart below is not a true representative of an Atlantic Tripole, it does show the different areas. The black arrow designates the warm waters and the red arrow designates the cooler waters. In a non-Atlantic Tripole, the areas north of 40° are much cooler waters. A bit later in the season the southern Atlantic (the tropical area) is expected to be much warmer. With much warmer waters and tropical waves emerging from the coast of Africa those tropical waves have a better chance of possibly developing into something tropical.

sst anomaly tripole


NAO

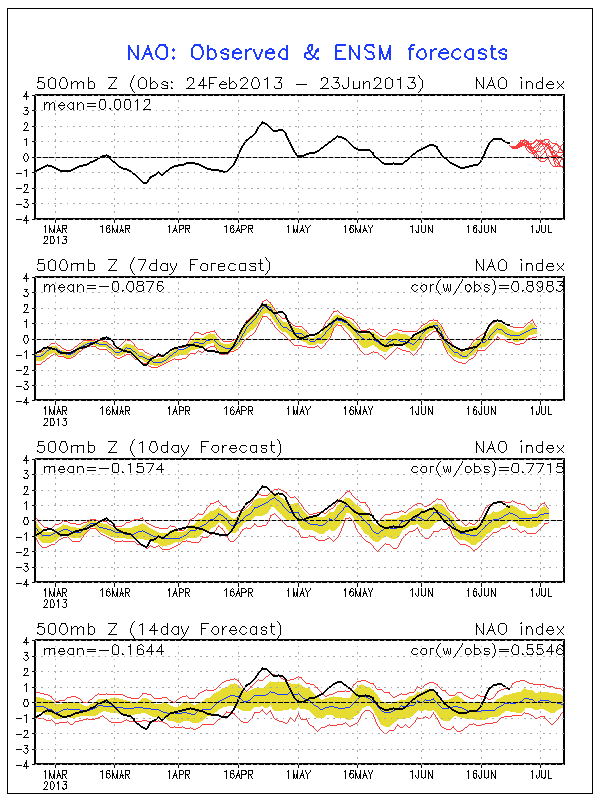
Our attention is now focused in the NAO. All indicators reflect a Positive NAO. The Azores high is further south which can allow tropical systems to head further West or WNW. In the chart below is the latest NAO forecast both the Observed and Ensemble. The black line being the observed and the smaller lines from the different ensemble members. It you note that nearly all are indicating a Positive NAO. If you may recall from your Meteorology 101 course, a Positive NAO allows the latitudinal displacement of the Azores high further southward. For the time being the NAO is in a Positive phase but it is expected later in the season for the NAO to go into a Negative phase.

nao chart


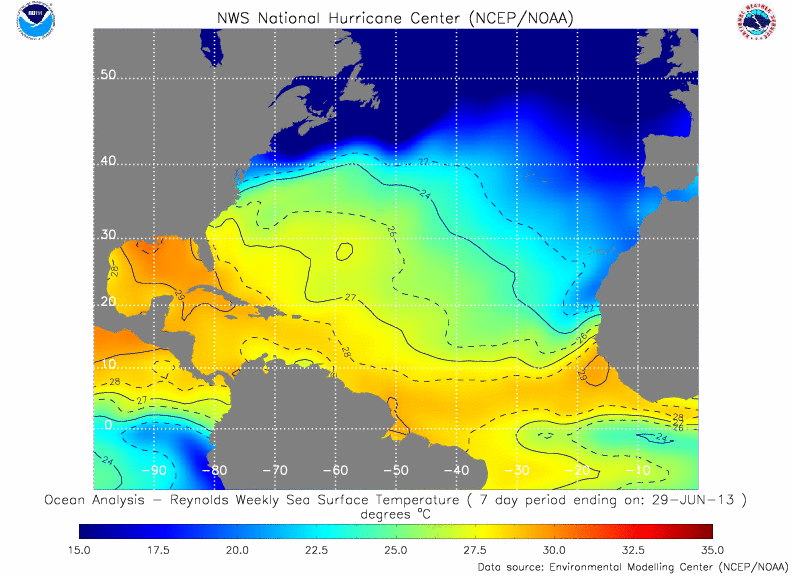
SST’s In The MDR
The abnormal high SST’s in the MDR is something I cannot emphasize enough. Recalling that a tropical system’s primary energy source is the [tooltip title=”Info ” content=”Also known as latent heat” type=”info” ]evaporation of water from the ocean surface[/tooltip], higher SST’s may allow easier development of of tropical wave, although there are other factors needed.

sst analysis
SST Analysis


MJO

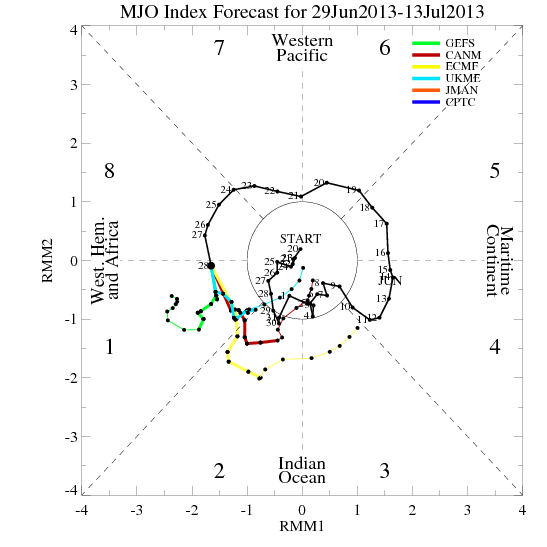
As discussed earlier, the MJO progresses eastward with two different phases. At this time, the MJO is entering the East Pacific and Western Caribbean is a Positive phase. In the Positive phase, upward motion or lift and moisture allows easier development of convection/thunderstorms. The chart below can be a bit confusing but itself is a simple one once you comprehend how it works.

mjo full

Looking at chart, you will notice that there 8 Octants with Octant 1 at the lower right and Octant 8 at the upper left. You will also notice near Octant 6 a legend for some of the different weather models with different a color for each. Next, you will notice a circle in the middle. You will also see (sometime difficult to read) numbers which correspond the different days (or index). For simplification, if the index is within the circle the MJO is considered weak. If the Index is outside the circle, then the MJO is considered a strong pulse. The MJO in the diagram moves counter-clockwise direction even though the MJO itself runs from west to east. You might have noticed the RMM1 and RMM2. Although this is something we need to worry about but the RMM1 and the RMM2 are simply mathematical methods which combine cloud amount along with winds at the upper and lower atmosphere. This provides a measure of the strength and location of the MJO.
To make things easier, we are only going to need octants 8 (East Pacific & Gulf of Mexico/Caribbean) and octant 1 which is the Atlantic basin. In the example above, near 28 in octant 1, you can see that several models (UKMET, GEFS, ECMF, CANM) all are outside the circle. Please note though, even if the MJO diagram is showing the different strong pulses within the different models, this does not always mean a development is imminent. This just means that there is usually upward motion or lift in the region and the possibility of easier thunderstorm activity.

PDO

Although not stated earlier, the  PDO is a long-term ocean fluctuation of the Pacific Ocean and wanes and waxes approximately every 20 to 30 years. When there are changes in the locations in the Pacific between the cold and warm water masses, they alter the path of the [tooltip title=”Jet Stream” content=”Fast flowing, narrow air currents found in the atmosphere.” type=”info” ]jet stream[/tooltip]. The easiest way to state this is that the jet stream in the northern hemisphere delivers the the different storms across the US. In this case the PDO is in a Negative (or cool) phase and this will will try to steer the jet stream further north over the Western portion of the US but this also allows for possible [tooltip title=”Tropical Cyclogenisis” content=”Cyclogenesis is the development or strengthening of cyclonic circulation in the atmosphere (a low pressure area).” type=”info” ]tropical cyclogenesis[/tooltip] in the Atlantic. The diagram below shows the different warm and cool phases.

pdo warm and cool phases


Summary

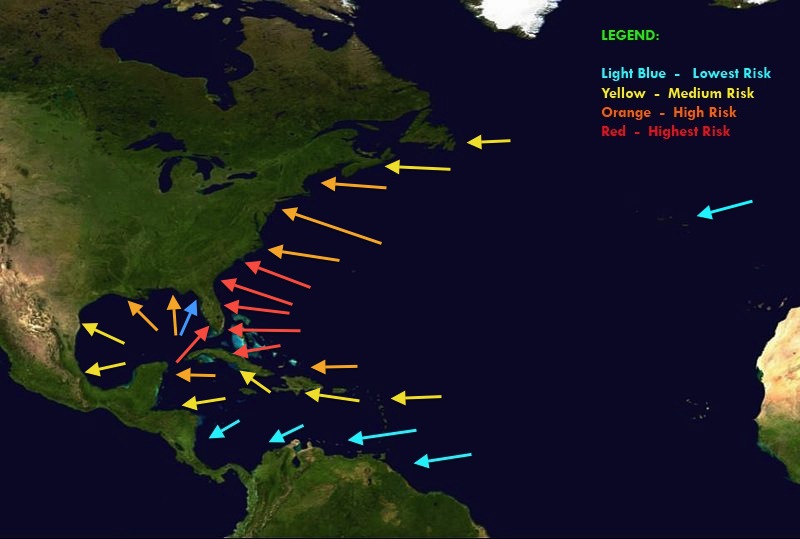
Although no one (not even the Specialists at the NHC) can tell exactly what the 2013 hurricane season will be like, using some the factors I outlined in this post, it does appear that this hurricane season will be a much more active season. When you have a Negative PDO, a Neutral ENSO but with a cold bias, a Negative NAO, extremely warm SST’s in the MDR, along with a Atlantic Tripole, all these factors (along with others we have not discussed) do seem to favor a season of much higher activity. It is unrealistic to even try as to where (if any) landfall will occur but just using the above factors along with some analogue years for comparison, areas of risk for possible cyclone landfall are higher in some locations whereas other will have a lower risk. The graphic below is a generalization and is not meant to alarm those in the higher risk areas.

North_Atlantic_Basin_Risk_Areas


Okay, now that wasn’t too bad was it. Hope you enjoyed your short class of Meteorology 101 and that it hopefully paid out and I hope you learned a little in the meantime. Please note this was a generalization of what the 2013 hurricane season might like and many contributing factors may and will usually change throughout the hurricane season. If you are not sure on any of the items discussed, please feel free to Contact Me at the top of the page. Remember, I am not a trainer meteorologist. As with any storm, please check with your local WFO or the NHC>

Lastly, and most importantly, please be sure to put together your Emergency and Hurricane Survival Kit if you have not already done so. If you have pets, please be sure to have plans to care for them. Check your homeowners or renters insurance before any possible storms develop and ensure you are properly covered for property damages and I would highly recommend that you also take flood insurance.