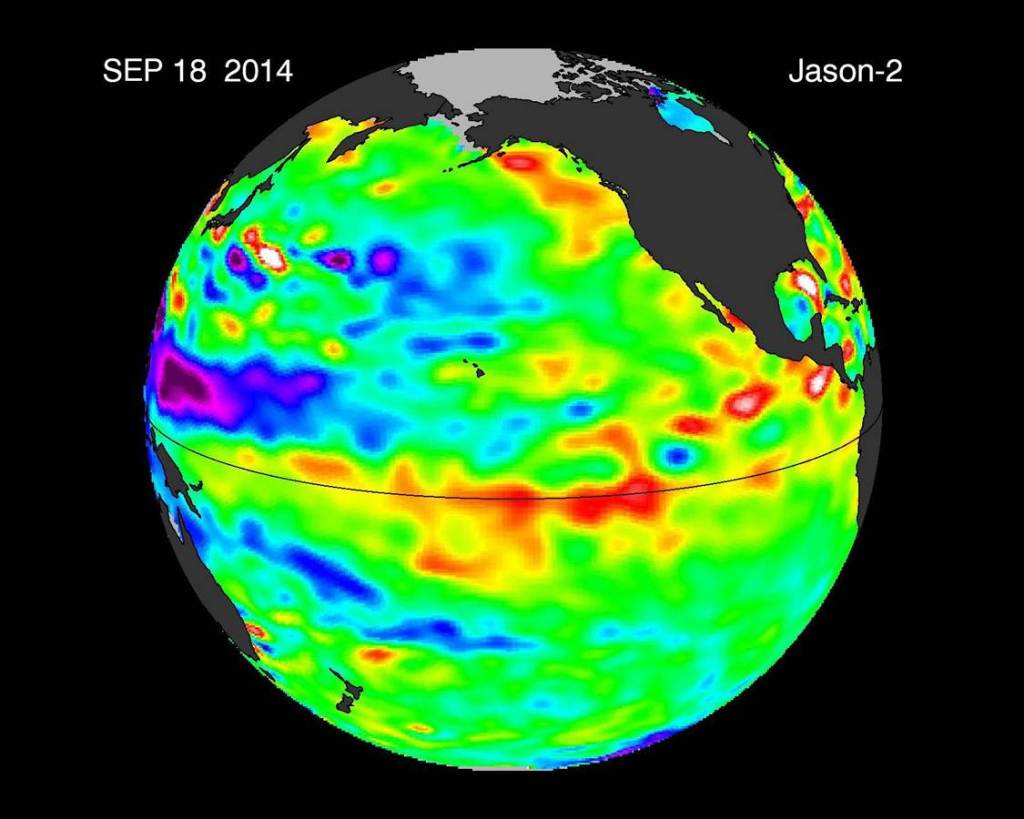
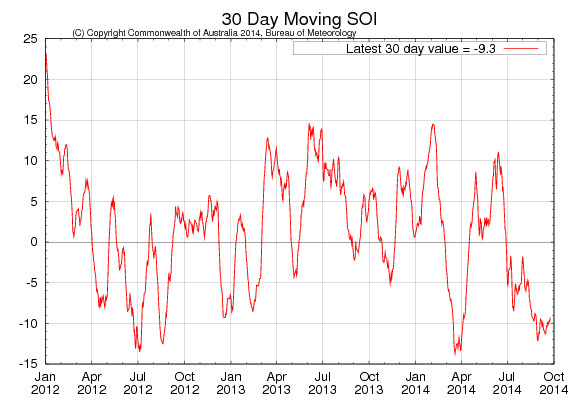
Before the 2014 Atlantic hurricane season began, it was touted by most experts to be an “El Niño” year mostly due to some the early indicators. A few things Meteorologists monitor when it comes to tropical development in general include: Wind Shear strength, Sea Surface Temperatures/Deep Sea Temperatures, measuring of the SOI (Southern Oscillation Index) in the case of an El Niño or La Niña, and the MJO (Madden Julian Oscillation). A simplified description of an El Niño is basically an area in the Pacific Ocean that begins to warm up to more than above average sea surface temperatures. An El Niño can cause strong winds to blow eastward over Mexico and help shear off the cloud tops of thunderstorms. This helps to reduce both the number and the intensity of tropical storms and hurricanes that might be trying develop in the Atlantic. Between February-May, just before the hurricane season would begin, there were a series of Equatorial [tooltip title=”Kelvin waves” content=”Kelvin wave, in oceanography, an extremely long ocean wave that propagates eastward toward the coast of South America, where it causes the upper ocean layer of relatively warm water to thicken and sea level to rise. Kelvin waves occur toward the end of the year preceding an El Niño event when an area of unusually intense tropical storm activity over Indonesia migrates toward the equatorial Pacific west of the International Date Line. This migration brings episodes of eastward wind reversals to that region of the ocean which spawn Kelvin waves. Although such intense tropical storms of the western Pacific are associated with the development of El Niño, they may occur in other years to produce Kelvin waves that also propagate eastward but continue poleward toward Chile and California.” type=”info” ]Kelvin waves[/tooltip] in the Pacific which allowed for the possibility of a moderate to strong El Niño. While the Kelvin waves did transport the higher than normal sea surface heights, the atmosphere did not follow along with the Kelvin waves and the waves eventually faded away. Recently though, two more eastward moving Kelvin waves were seen via the Jason-2 satellite. Will these two Kelvin waves be the precursor for the El Niño? Even if they do, the El Niño would most likely be a weak to moderate one.  Courtesy NASA/JPL-Caltech Another possible indicator of an El Niño is that the shift in the SOI has now been in negative territory. Although this is not a true indicator as of yet, the SOI needs to have sustained negative values below −8. Close but no cigar.
  Courtesy: Australia Bureau of Meteorology ******* For the math minded ******** There are a few different methods of how to calculate the SOI. The method used by the Australian Bureau of Meteorology is the Troup SOI which is the standardised anomaly of the Mean Sea Level Pressure difference between Tahiti and Darwin. It is calculated as follows:
$latex SOI = 10 \frac{(Pdiff – Pdiffav)}{SD(Pdiff)} \ $
where: Pdiff = (average Tahiti MSLP for the month) – (average Darwin MSLP for the month), Pdiffav = long term average of Pdiff for the month in question, and SD(Pdiff) = long term standard deviation of Pdiff for the month in question. The multiplication by 10 is a convention. Using this convention, the SOI ranges from about “35 to about +35, and the value of the SOI can be quoted as a whole number. The dataset the Bureau uses has 1933 to 1992 as the climatology period. The SOI is usually computed on a monthly basis, with values over longer periods such a year being sometimes used. Daily or weekly values of the SOI do not convey much in the way of useful information about the current state of the climate, and accordingly the Australian Bureau of Meteorology does not issue them. Daily values in particular can fluctuate markedly because of daily weather patterns, and should not be used for climate purposes.
*************************************
So what does this mean for this year’s Atlantic hurricane season? Probably not a whole lot. So far there is no empirical evidence either way to back up any claims of a possible El Niño. What is known is that in the Pacific, trains of Tropical cyclones in the Pacific are still developing where as in the Atlantic basin this has been a very slow hurricane season with one tropical storm and four hurricanes, with Hurricane Edouard being a major hurricane, albeit short lived as a major. As the [tooltip title=”Cape Verde” content=”A Cape Verde-type hurricane is an Atlantic hurricane that develops near the Cape Verde islands, off the west coast of Africa. The disturbances move off the western coast of Africa and may become tropical storms or tropical cyclones within 1,000 kilometres (620 mi) of the Cape Verde Islands, usually between July to September. ” type=”info” ]Cape Verde[/tooltip] season is slowly drawing to an end, the remainder of the tropical cyclone development (if any) will most likely be in the Western Caribbean and the Gulf of Mexico with the possibility of development closer to the U.S. Eastern coast. It would be foolish for me to to postulate whether the rest of the Atlantic hurricane season will continue to be as slow as it has been and whether the forecasted El Niño has been the cause (whether it is classified or not). As a stated in an earlier post:
So, how do we get a better feel of the hurricane season activity for this year? One method called [tooltip title=”ACE” content=”Accumulated Cyclone Energy” type=”info” ]ACE[/tooltip] Index. ACE Index is using a sum of the energy accumulated with all the cyclones (tropical storms, sub-tropical storms and hurricanes) that happened to form within the hurricane season. Calculating ACE is done by using the square of the the wind speed every six hours during the storm’s lifetime. Remember, a tropical depression is below 35 knots and it is not added. Hence, a cyclone that is longer lived will have a higher ACE indices verses a shorter lived cyclone which will have a lower ACE indices.  ACE indices of a single cyclone is windspeed (35 knots or higher) every six hour intervals  (0000, 0600, 1200, 1800 [tooltip title=”UTC” content=”Coordinated Universal Time (UTC) is the primary time standard by which the world regulates clocks and time.” type=”info” ]UTC[/tooltip]) or ACE = 104 kn2. Total ACE: $latex \Sigma = \frac{Vmax^2}{10^4} \ &s=2\ $ * Vmax is estimated sustained wind speed in knots. * An average seasonal ACE in the Atlantic is between 105 -115 or mean average of 110. Although technically we are in a Neutral state, this season “almost” seems more like a El Nino year. An El Niño tends to hinder tropical cyclone development in the Atlantic, due to higher amounts shear. But in a true El Niño year, you normally will have a very active season in the East Pacific (EPAC), with a few major hurricanes, and a subdued Atlantic.
In the figure below, as of this time frame, the ACE Index for this year is actually lower than last years (36.1200). That said, there is still October and November for the possibility of Tropical Cyclone development. If any Tropical Cyclones do develop, I will add them into the ACE Index accordingly. Secondly, the ACE Index numbers in the chart are from the Operational Advisories. The numbers may change when the Tropical Cyclone Reports are released. A blue asterisk will be placed next to a Storm name when a TCR has been issued.
Addendum: As of 10/11/14, 0000 UTC advisory with Tropical Storm Fay, the ACE Index has now surpassed last years ACE. In addition, recently developed Hurricane Gonzalo now a category 4 hurricane, the ACE Index will continue to rise significantly. This the first time in the Atlantic basin there has been a category hurricane 4 since Ophelia in 2011.
|
2014 Atlantic ACE |
|
| Tropical Cyclone Name |
Max Wind Speed (in Knots)
|
ACE 104Â kn2
|
| Arthur * |
85
|
6.9475
|
| Bertha * |
70
|
5.5175
|
| Cristobal * |
75
|
7.9225
|
| Dolly |
45
|
0.8050
|
| Edouard * |
105
|
15.6325
|
| Fay * |
70
|
3.5600
|
| Gonzalo * |
125
|
25.9725
|
| Hanna * |
35
|
.2450
|
|
|
——–
|
|
ACE Total:
|
66.6025
|
As always, please be sure to use the official information from the NHC or your local NWS. Although care has been taken in preparing the information supplied through the Weather or Knot blog, Weather or Knot does not and cannot guarantee the accuracy of it. I am not a professional meteorologist and this post is prepared purely for entertainment purposes.

