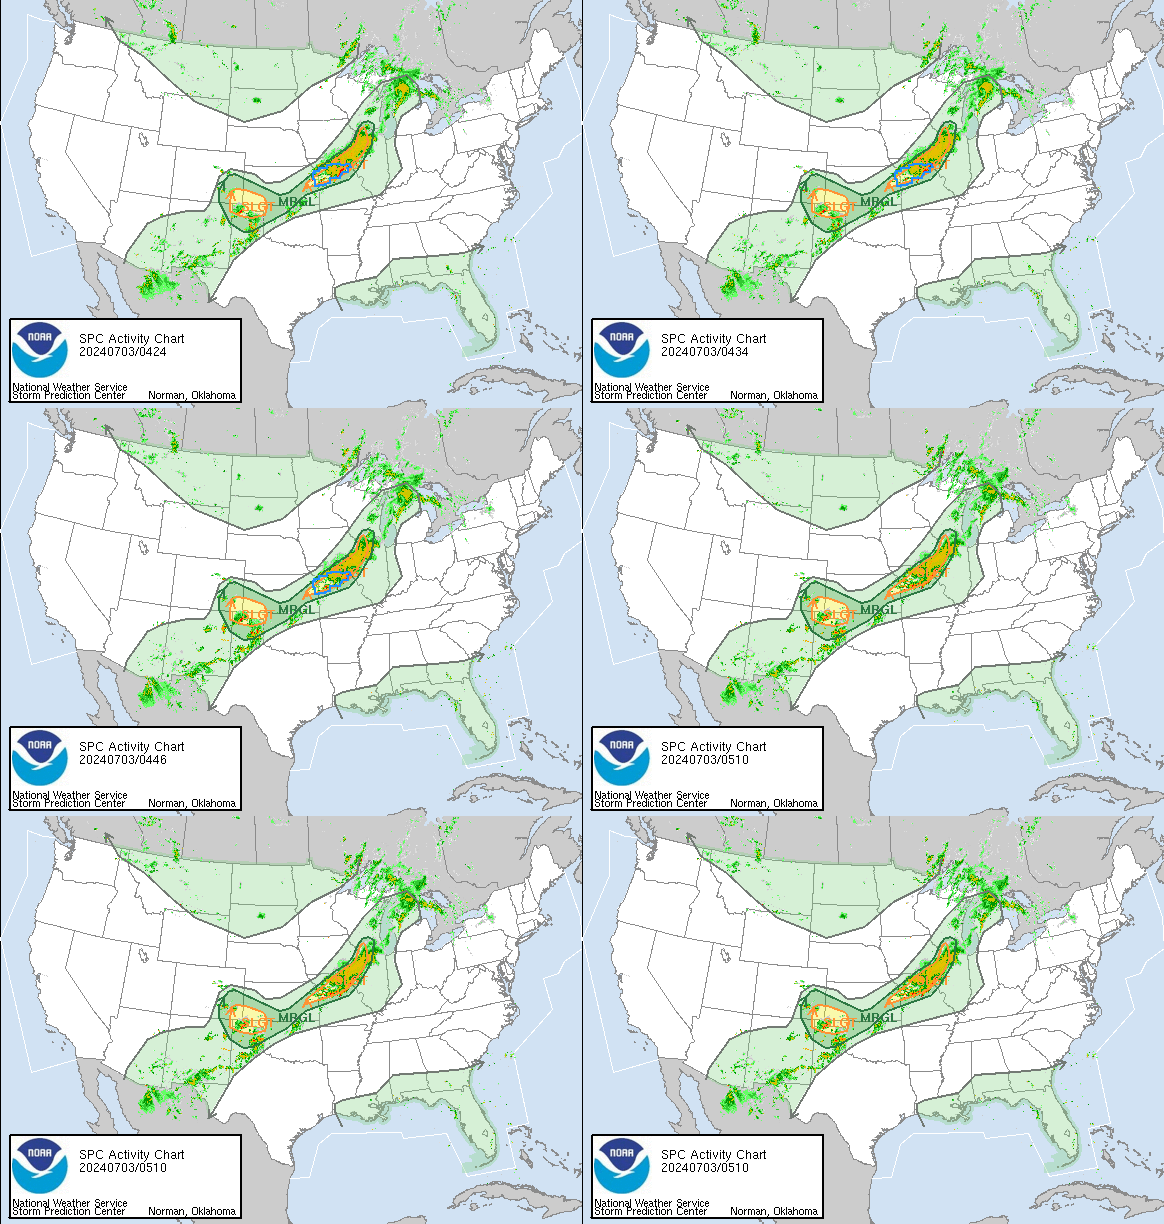
Explanation:
Areas within the orange arrow lines have some convective potential.
Areas within the green arrow lines have more convective potential and
a "slight" chance of severe weather. Red arrow lines highlight
areas of greatest severe weather potential.
Areas within the blue and red boxes are under severe thunderstorm or
tornado watches. When a warning is issued, the counties affected will
be highlighted in color.
Also displayed on this map is the NEXRAD loop of radar observations.
Lighter precipitation is shown in green, moderate in yellow and heavy
in red.


